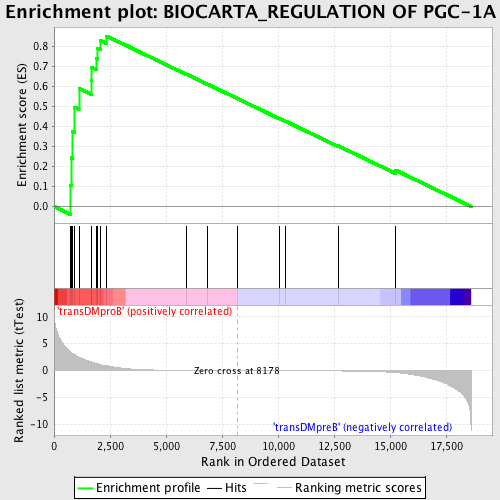
Profile of the Running ES Score & Positions of GeneSet Members on the Rank Ordered List
| Dataset | Set_04_transDMproB_versus_transDMpreB.phenotype_transDMproB_versus_transDMpreB.cls #transDMproB_versus_transDMpreB.phenotype_transDMproB_versus_transDMpreB.cls #transDMproB_versus_transDMpreB_repos |
| Phenotype | phenotype_transDMproB_versus_transDMpreB.cls#transDMproB_versus_transDMpreB_repos |
| Upregulated in class | transDMproB |
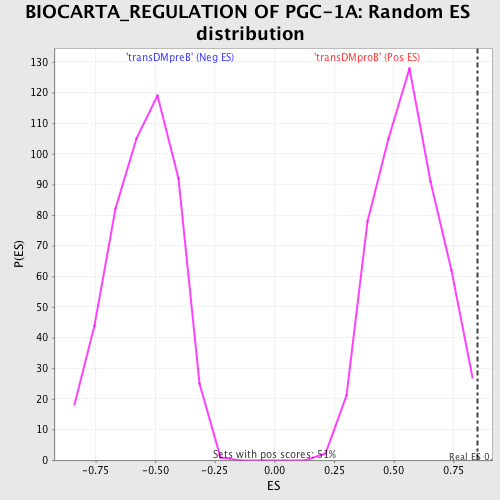
| GeneSet | BIOCARTA_REGULATION OF PGC-1A |
| Enrichment Score (ES) | 0.8500276 |
| Normalized Enrichment Score (NES) | 1.5194925 |
| Nominal p-value | 0.0058365758 |
| FDR q-value | 0.37645265 |
| FWER p-Value | 0.984 |
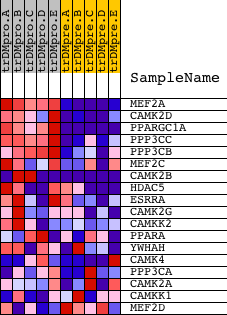
| PROBE | DESCRIPTION (from dataset) | GENE SYMBOL | GENE_TITLE | RANK IN GENE LIST | RANK METRIC SCORE | RUNNING ES | CORE ENRICHMENT | |
|---|---|---|---|---|---|---|---|---|
| 1 | MEF2A | 1201 5089 3492 | 738 | 3.451 | 0.1056 | Yes | ||
| 2 | CAMK2D | 4232 | 775 | 3.295 | 0.2424 | Yes | ||
| 3 | PPARGC1A | 16533 | 835 | 3.159 | 0.3722 | Yes | ||
| 4 | PPP3CC | 21763 | 894 | 3.021 | 0.4963 | Yes | ||
| 5 | PPP3CB | 5285 | 1113 | 2.475 | 0.5888 | Yes | ||
| 6 | MEF2C | 3204 9378 | 1666 | 1.612 | 0.6270 | Yes | ||
| 7 | CAMK2B | 20536 | 1673 | 1.604 | 0.6941 | Yes | ||
| 8 | HDAC5 | 1480 20205 | 1878 | 1.318 | 0.7386 | Yes | ||
| 9 | ESRRA | 23802 | 1937 | 1.252 | 0.7882 | Yes | ||
| 10 | CAMK2G | 21905 | 2068 | 1.101 | 0.8276 | Yes | ||
| 11 | CAMKK2 | 9870 | 2345 | 0.885 | 0.8500 | Yes | ||
| 12 | PPARA | 22397 | 5892 | 0.036 | 0.6609 | No | ||
| 13 | YWHAH | 5937 10368 | 6854 | 0.019 | 0.6100 | No | ||
| 14 | CAMK4 | 4473 | 8169 | 0.000 | 0.5394 | No | ||
| 15 | PPP3CA | 1863 5284 | 10076 | -0.024 | 0.4379 | No | ||
| 16 | CAMK2A | 2024 23541 1980 | 10344 | -0.028 | 0.4248 | No | ||
| 17 | CAMKK1 | 20793 | 12676 | -0.083 | 0.3029 | No | ||
| 18 | MEF2D | 9379 | 15241 | -0.390 | 0.1815 | No |